Easier detection of leaks and degradation in the hydraulic system

Reduce failure detect time

Optimize troubleshooting time

Greater clarity on system integrity
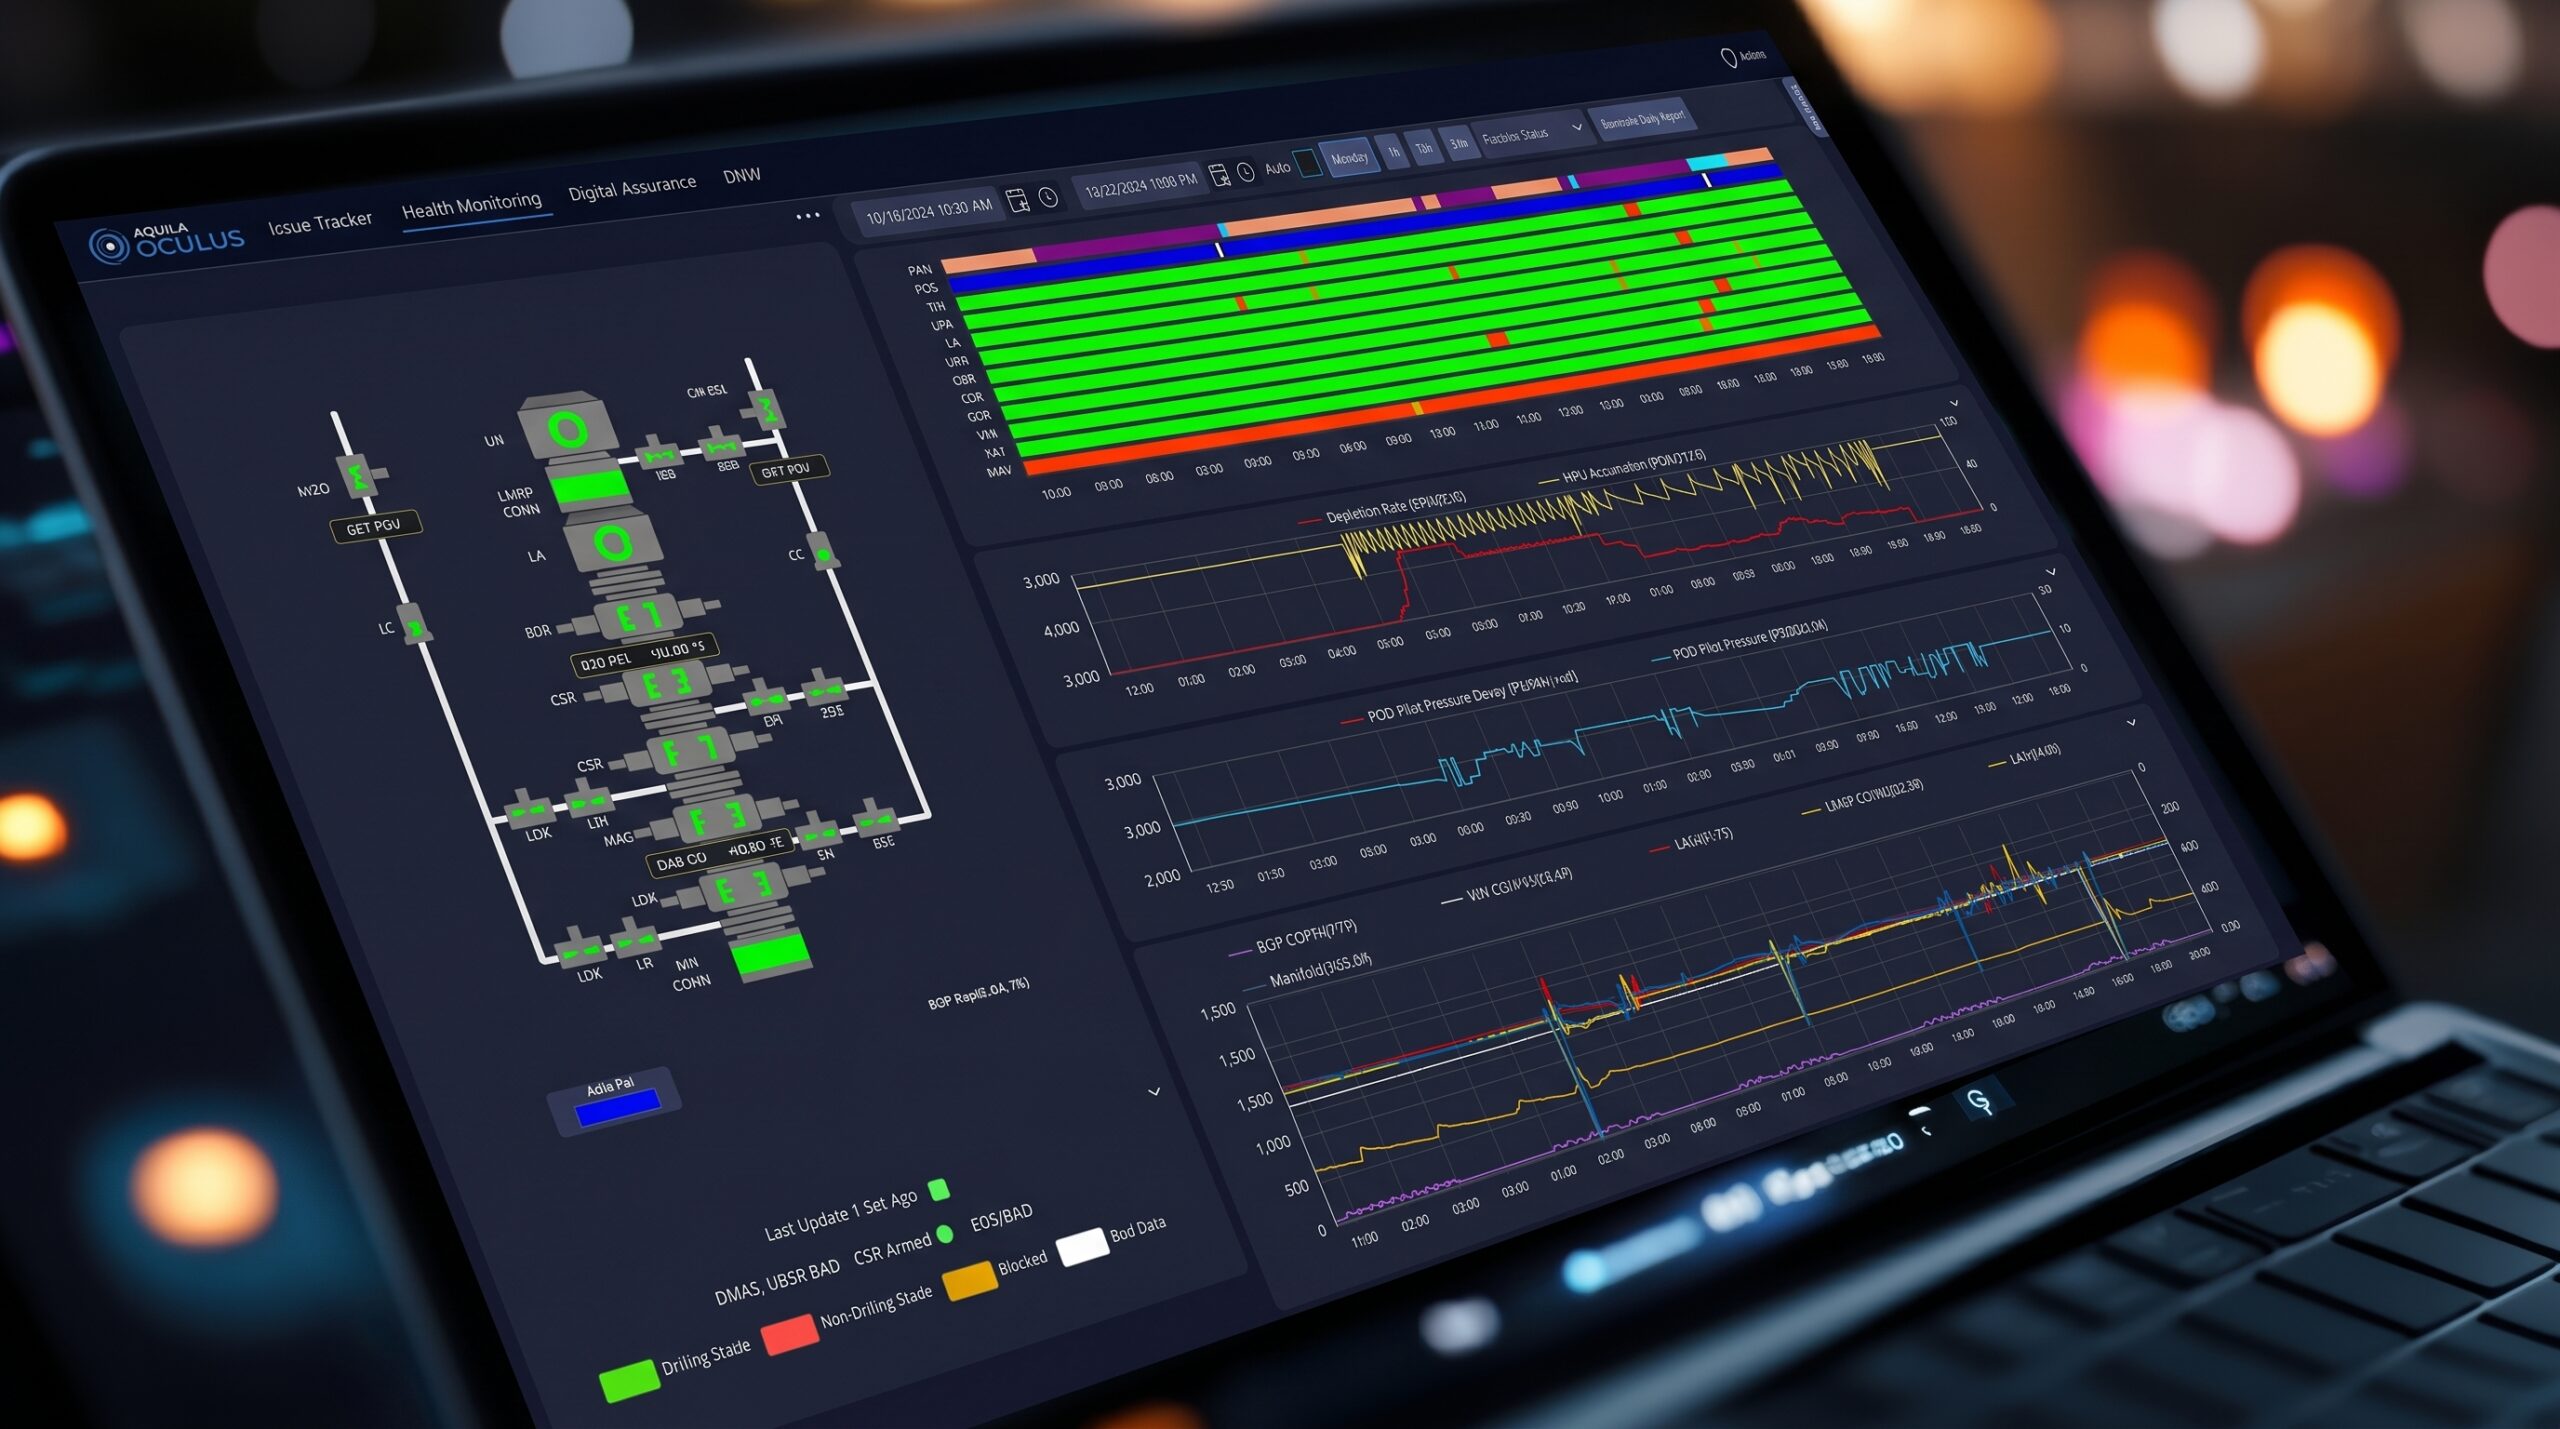


Real-time view of key BOP system parameters, including our depletion rate

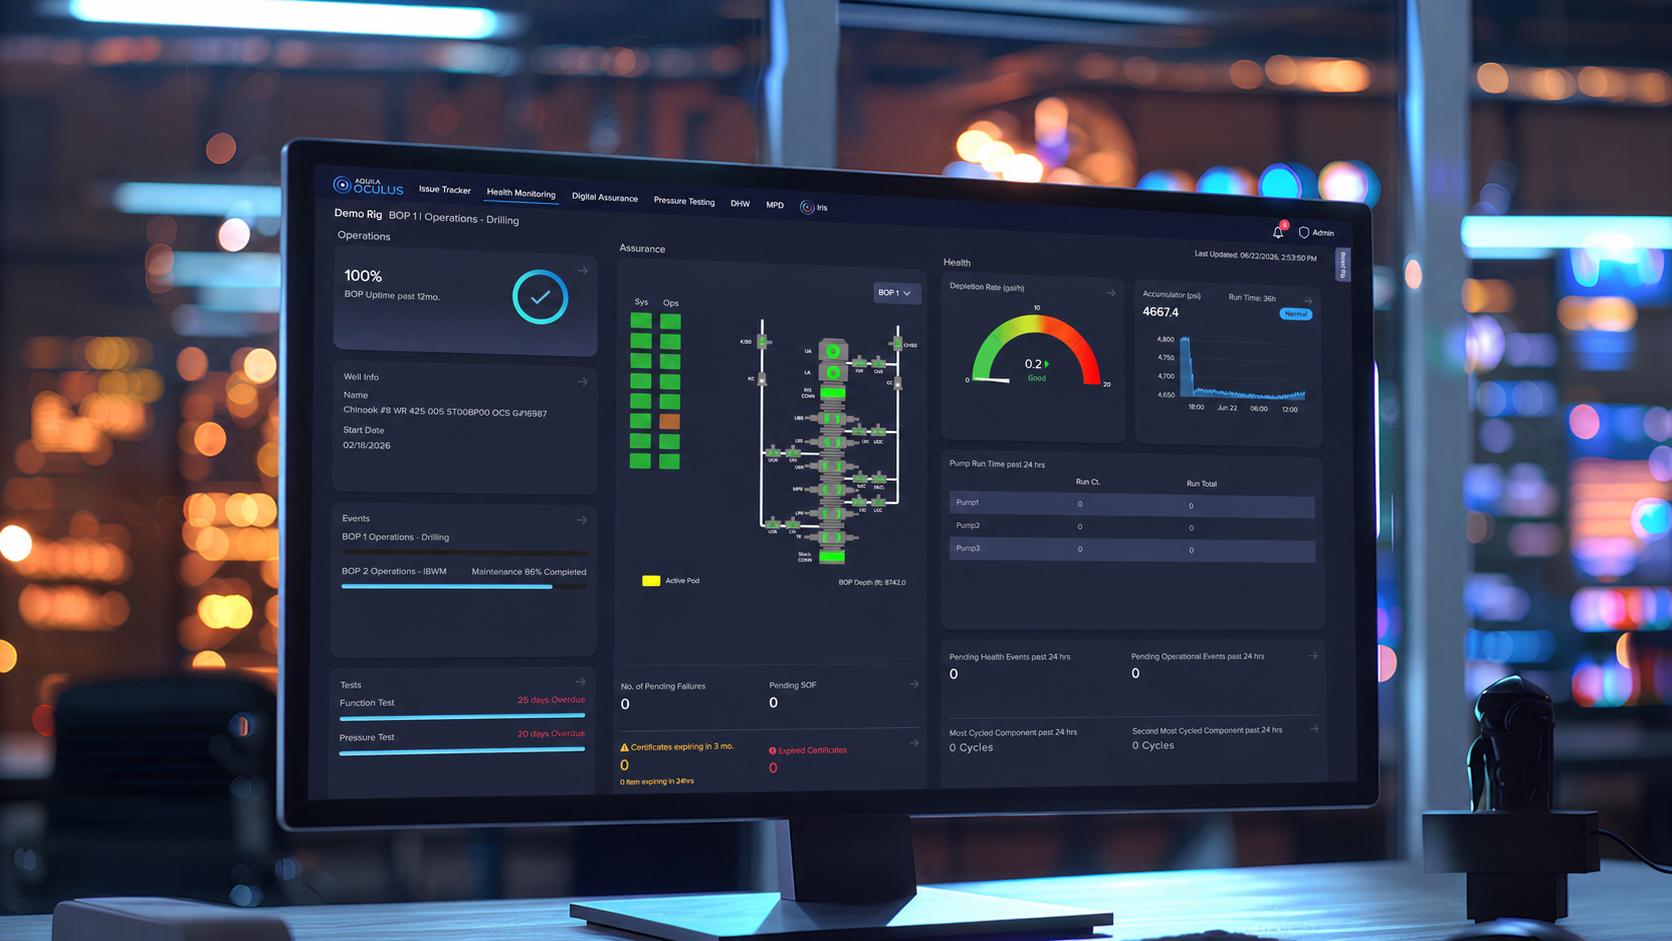
Hydraulic system dashboard with leak-tighned and valve performance analysis
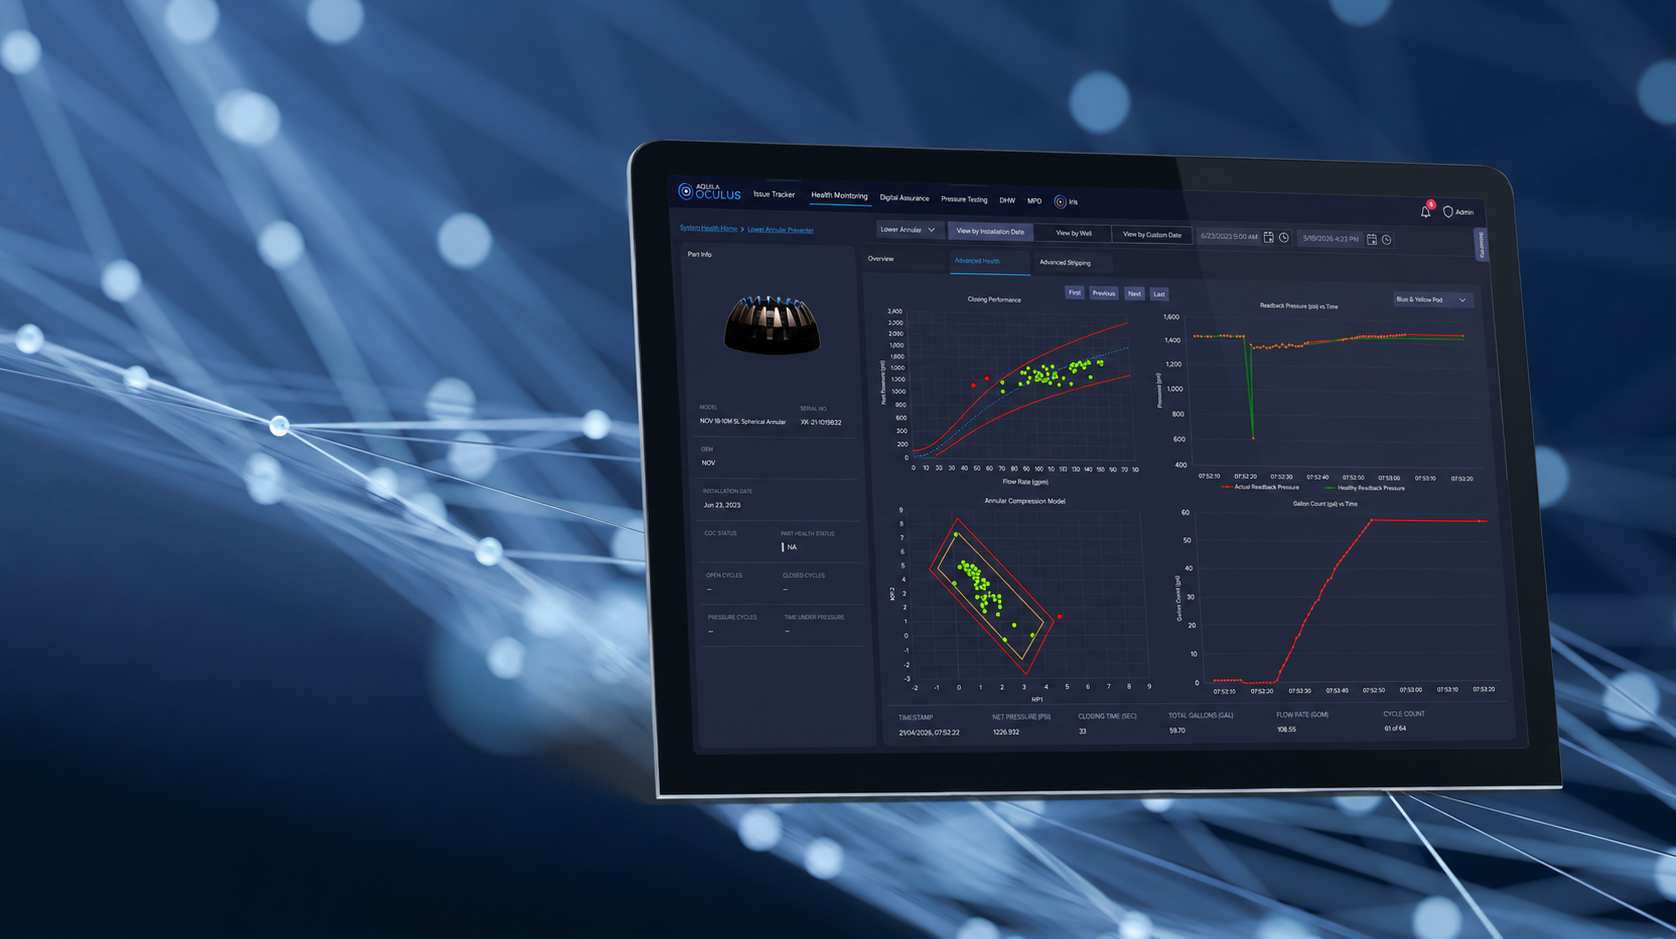
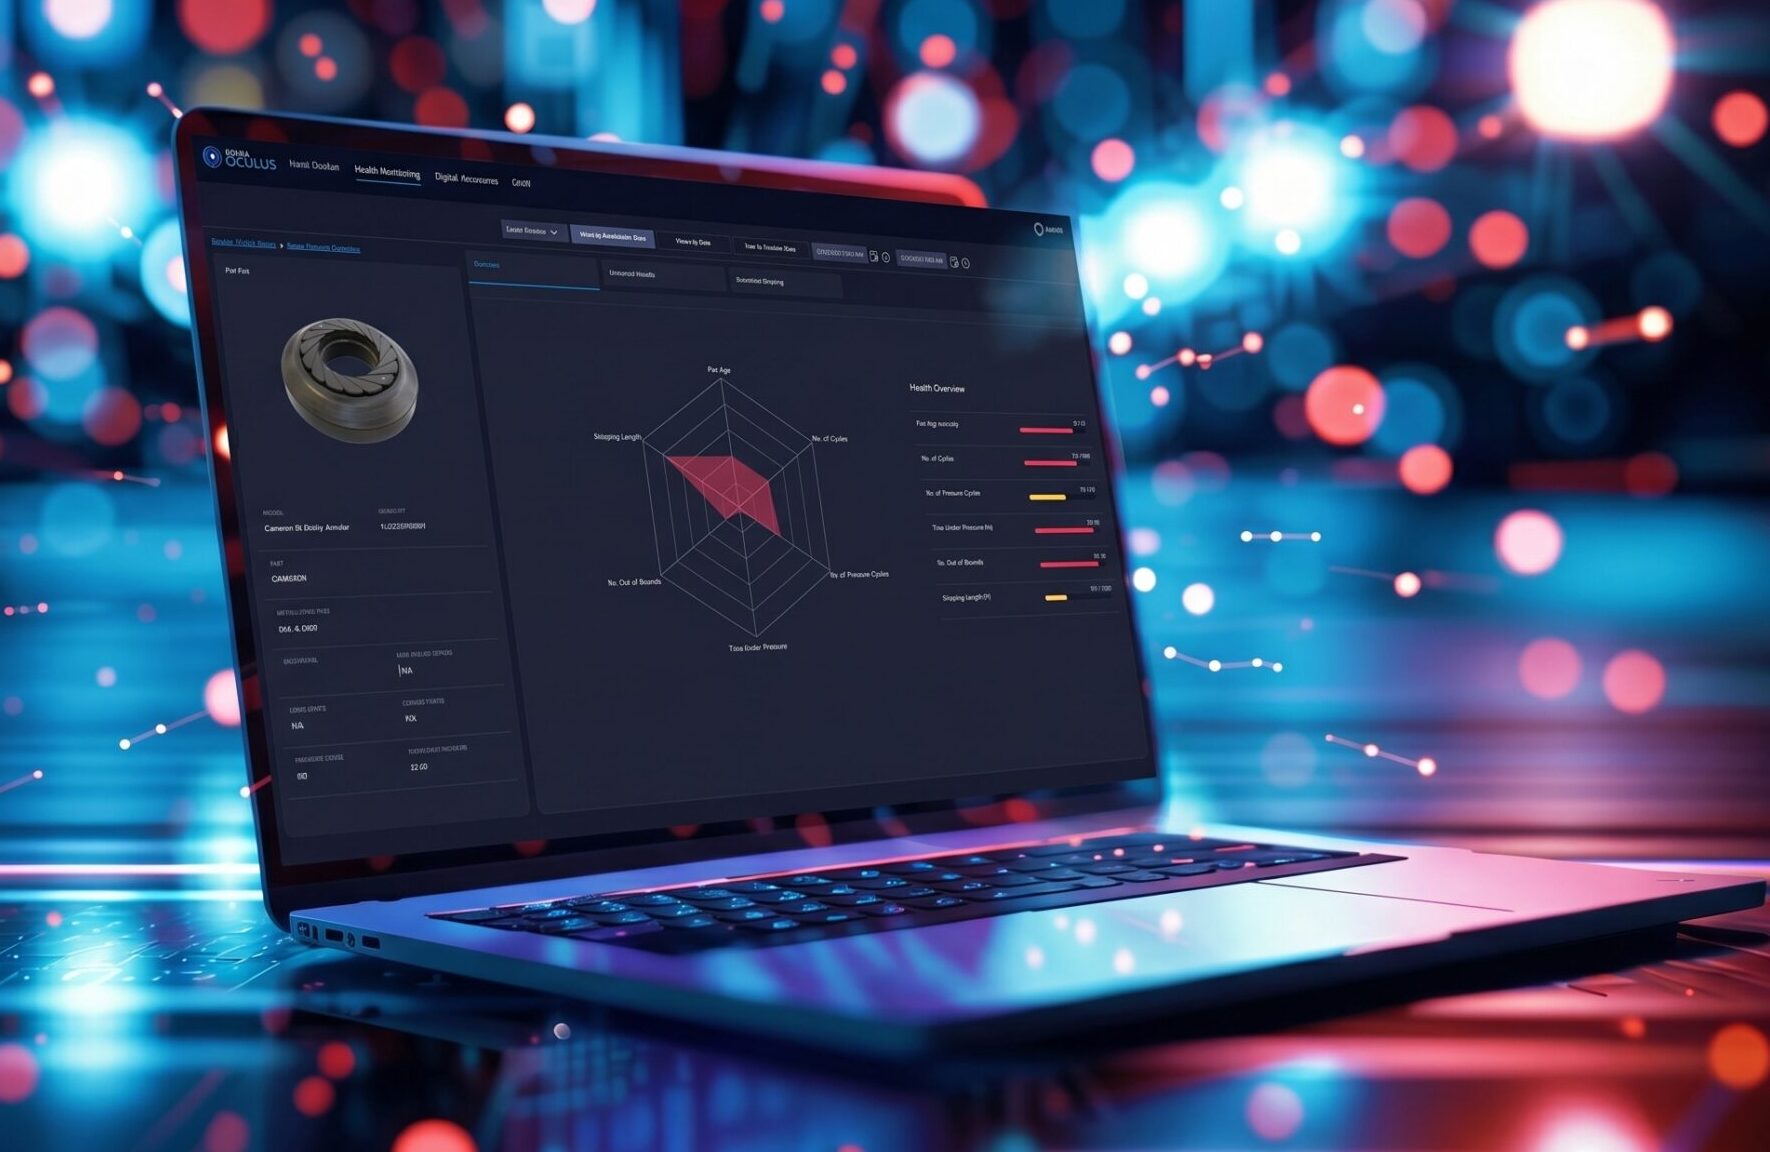
Component health dashboard with pressure and elastomer analysis

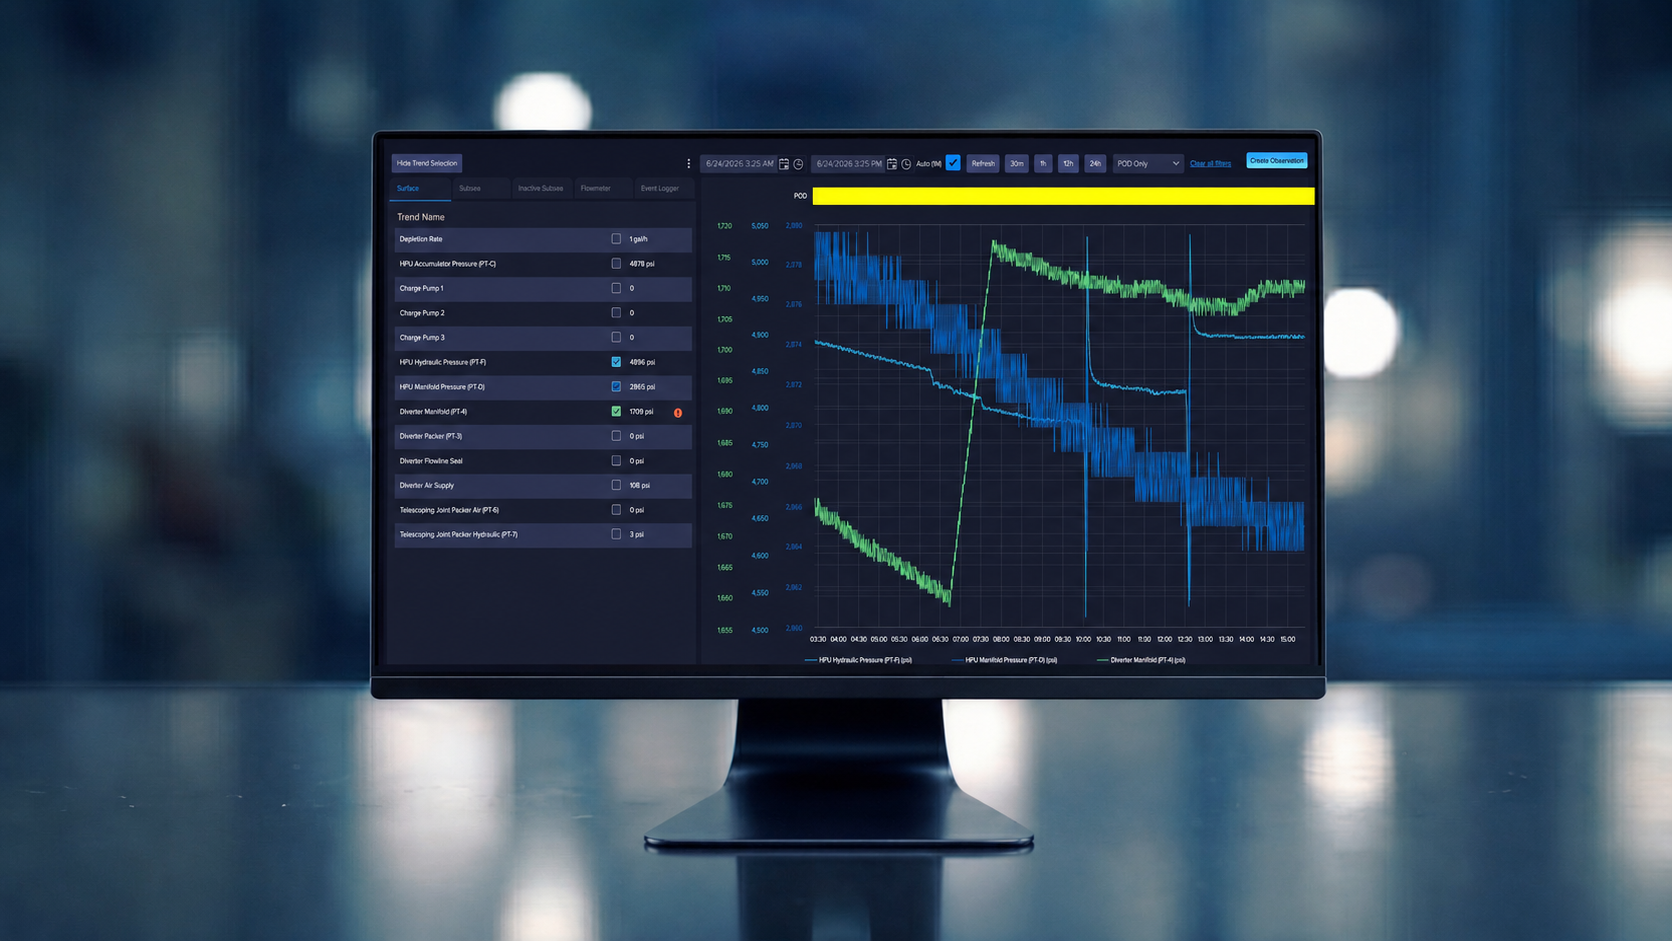
Multi-parameter dashboard with timeframe selection for troubleshooting
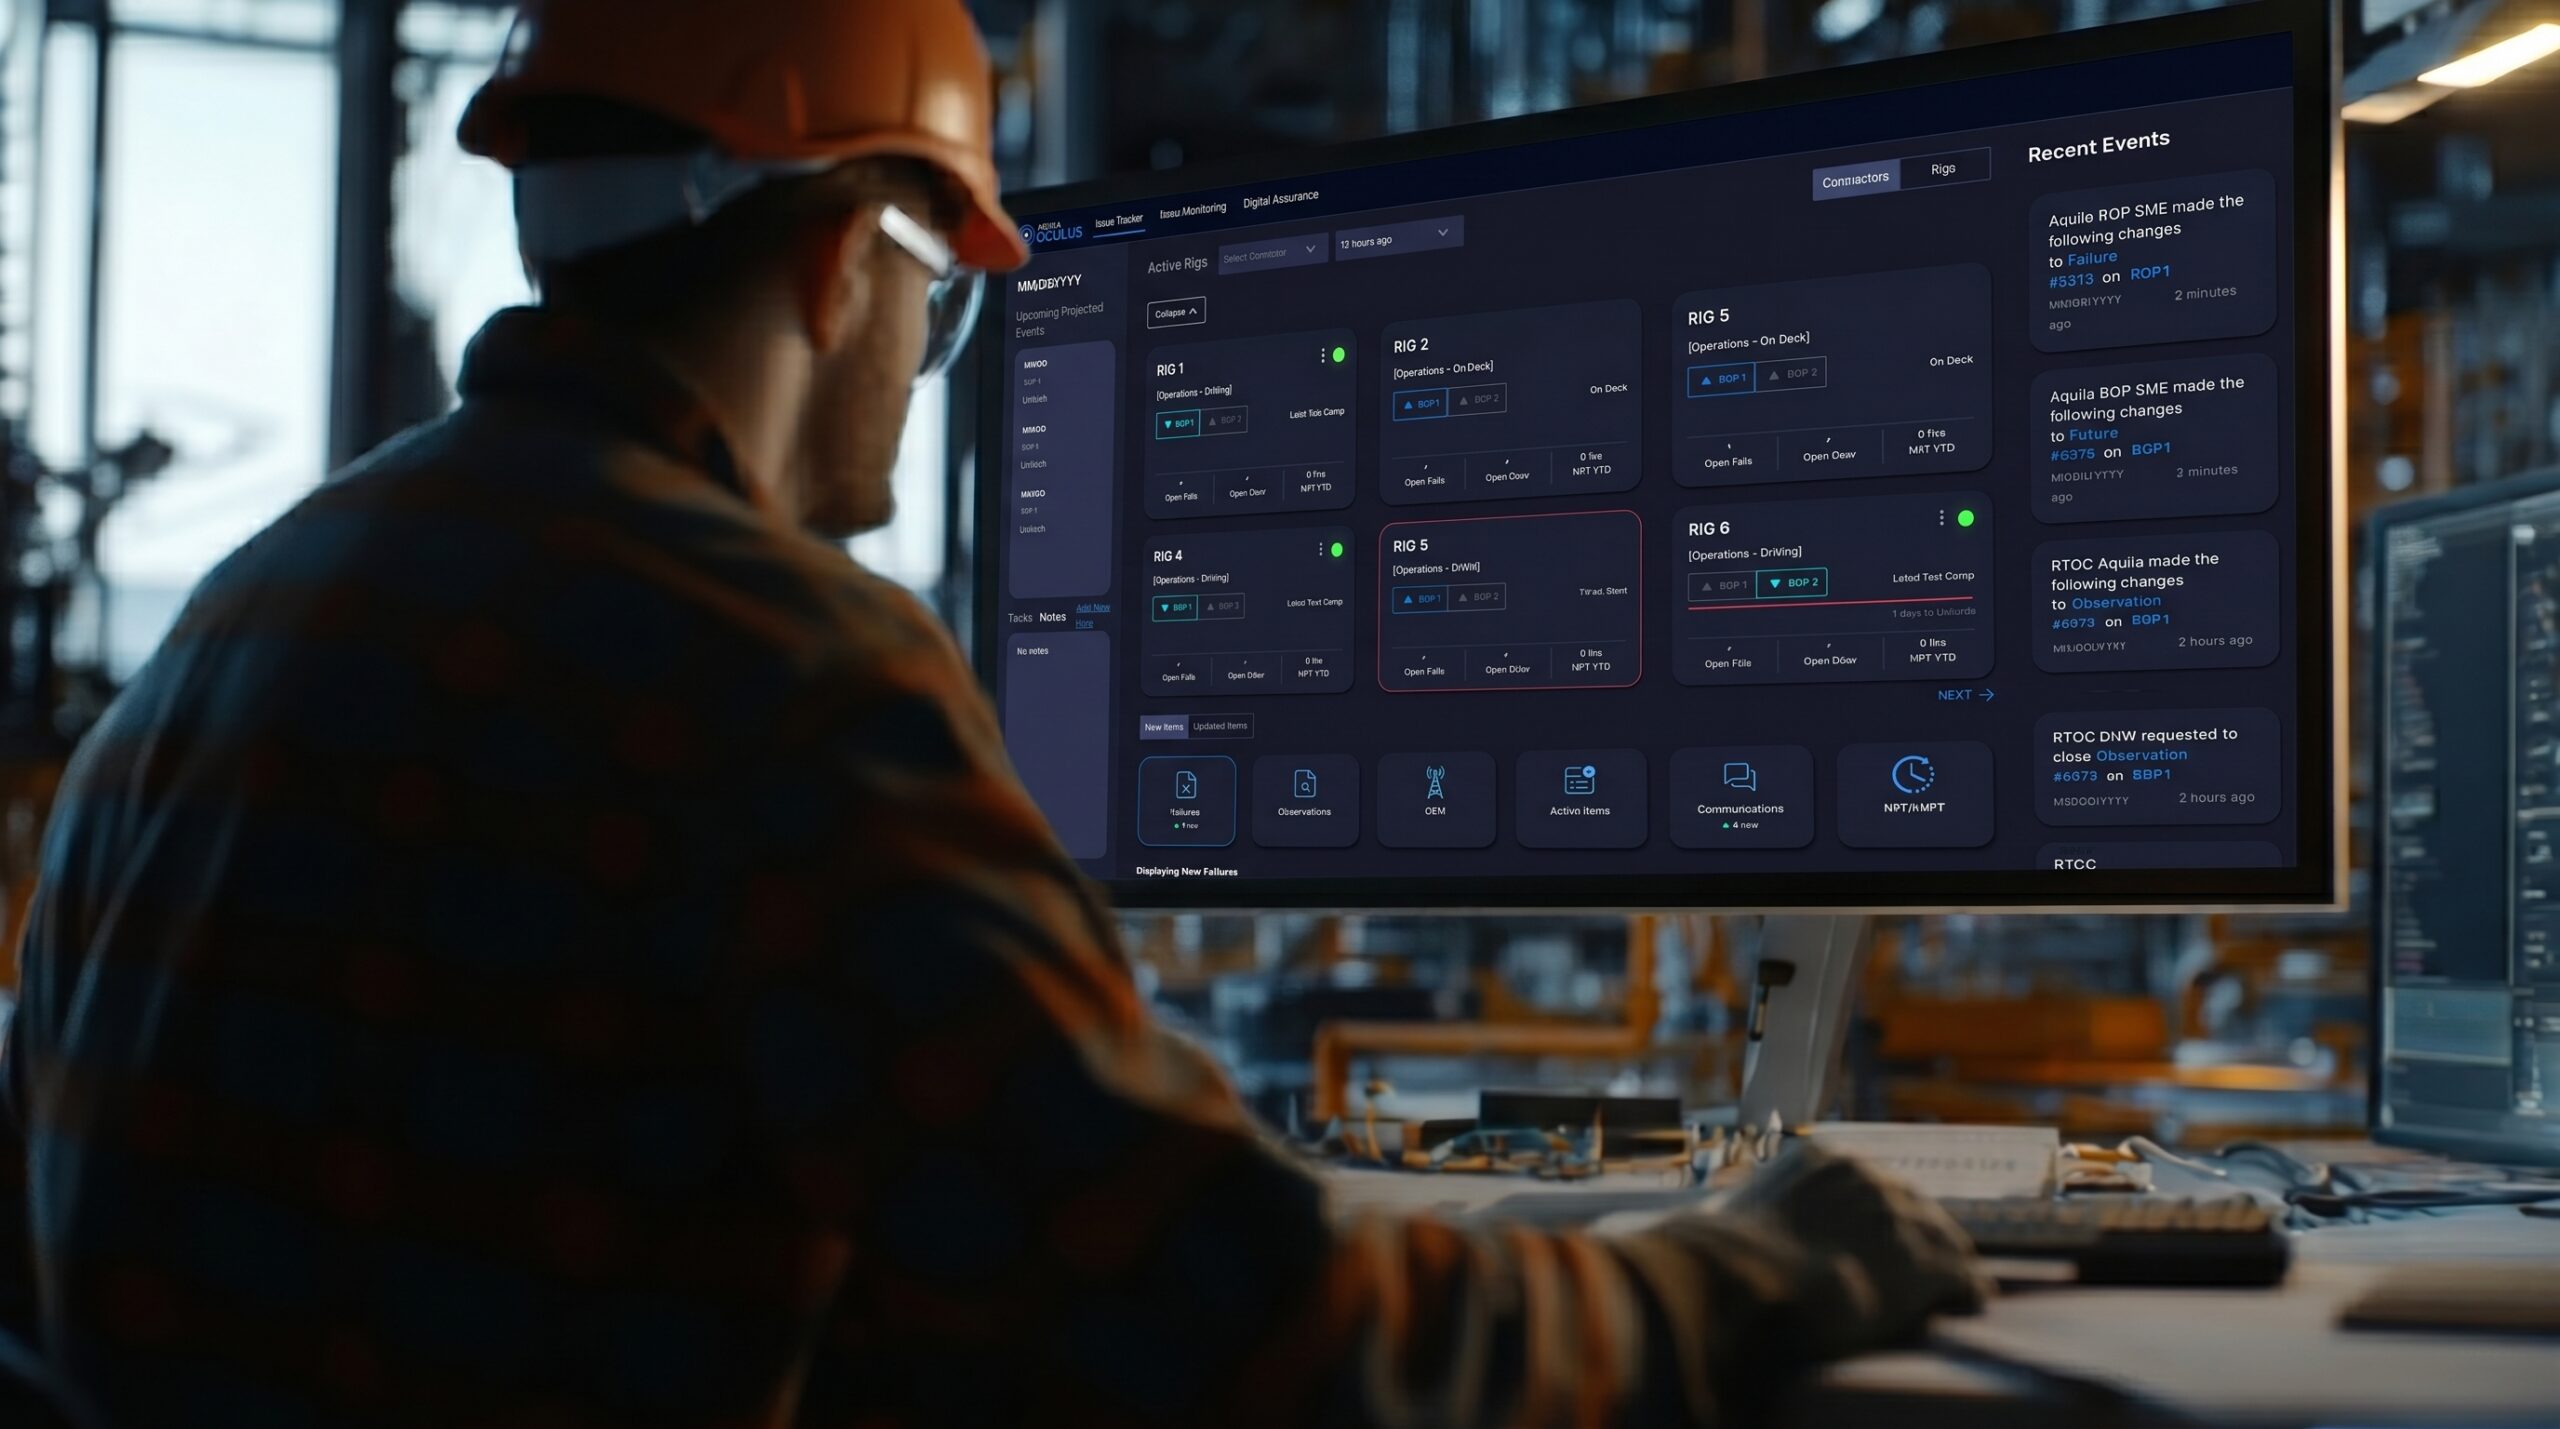
Platform centralizing BOP records, failures and connection history





Aquila's RTM platform captures every hydraulic signal across the BOP control system — depletion rates, accumulator pressure, regulator performance, pod utilization, and annular behavior — continuously, at the resolution needed to distinguish normal cycling from early-stage degradation

Predictive models cross-reference live hydraulic data against component history, elastomer compressibility profiles, and failure patterns — surfacing depletion anomalies, regulator drift, and seal degradation before they escalate into unplanned interventions or test failures.

Drilling engineers, subsea team, and well control teams receive contextual dashboards, trending views, and issue tracking records — backed by Aquila's 24/7 RTOC for senior engineering support when BOP integrity is on the line.

See how Aquila's RTM supports BOP reliability across the well lifecycle

Aquila's RTM continuously monitors pod pressure behavior during passive periods — measuring fluid loss at the resolution required to distinguish normal variation from genuine leakage or regulator inefficiency across blue and yellow pod circuits.
Depletion rate models evaluate gallon-per-cycle trends, accumulator decay curves, and regulator chatter patterns — isolating the source of anomalies with a precision that shortens troubleshooting time and removes guesswork from leak detection.
Operations teams gain clear, defensible system integrity assessments — with a full audit trail of depletion history, regulator performance, and hydraulic events, ready for regulatory reporting, client review, or failure analysis.
Learn how Aquila's depletion rate technology reduces hydraulic failure response time
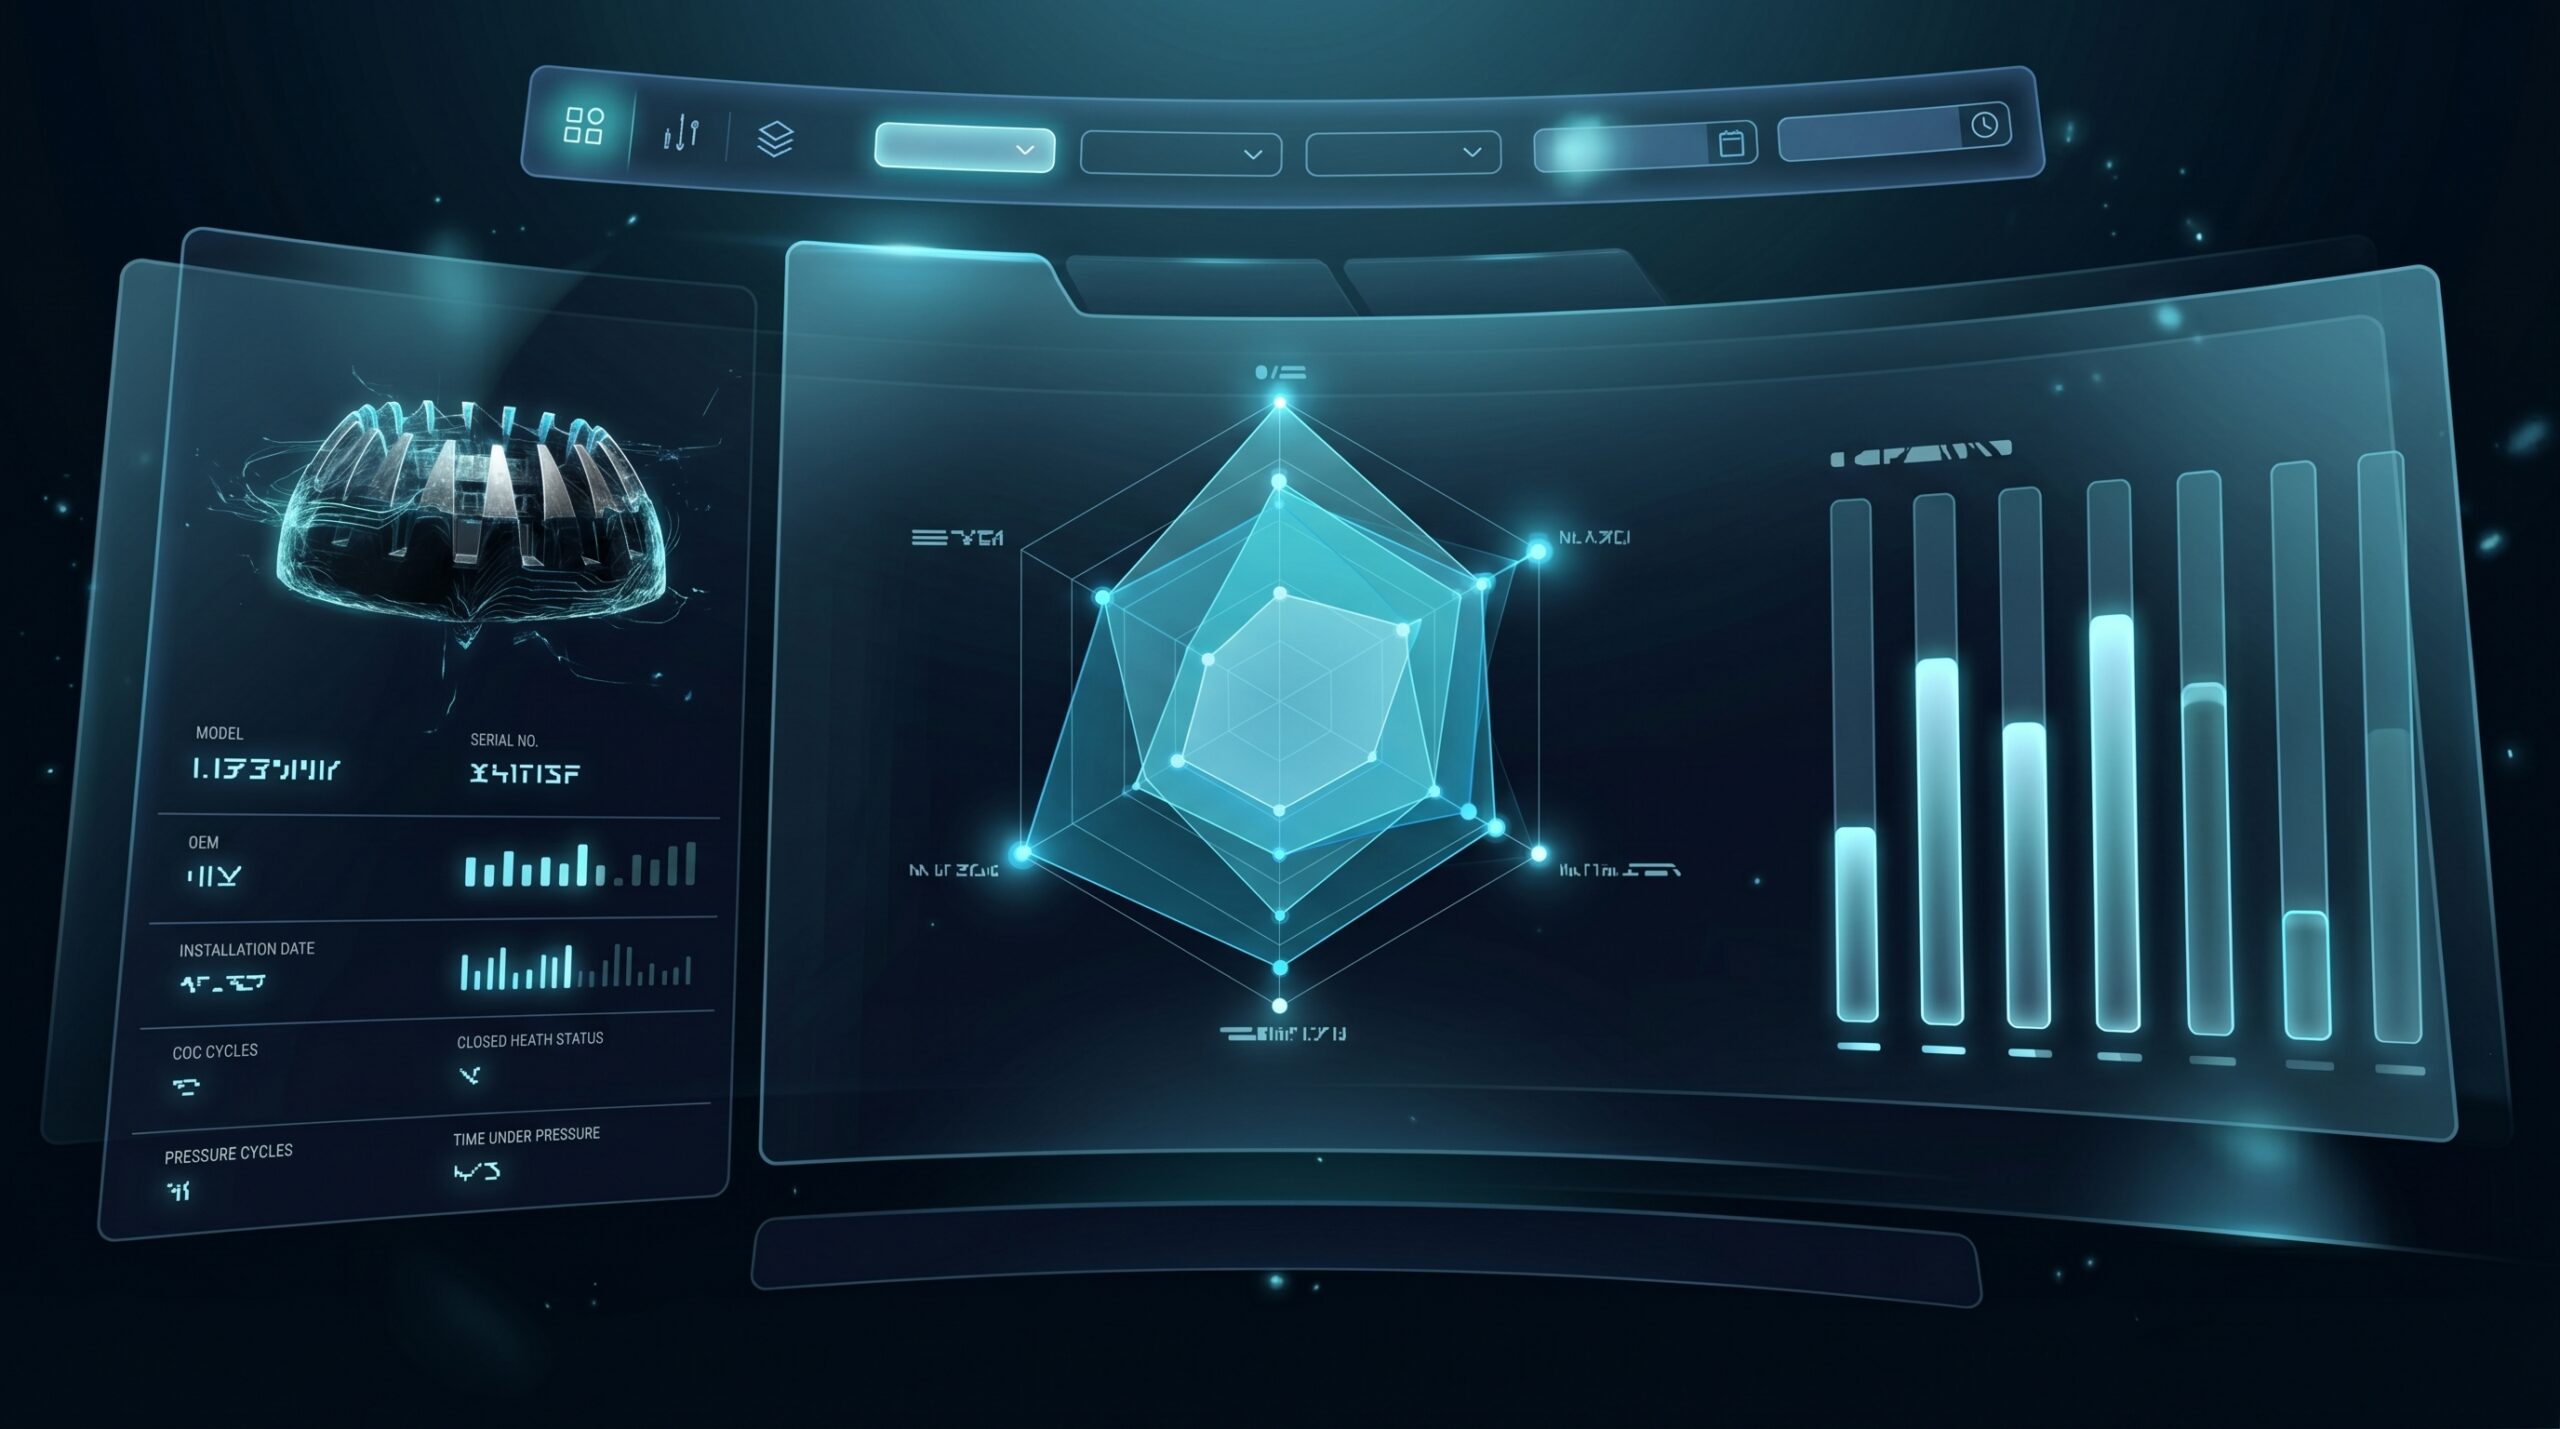
Aquila's RTM captures the full health picture of annular preventers — closing performance curves, readback pressure trends, gallon count, elastomer compressibility, cycle count, and installation history — consolidated into a single component view.
Advanced analytics for tracking part age, stripping length, pressure cycle exposure, and out-of-bound events to build a multi-dimensional risk profile for each annular component.
Component health scores, maintenance alerts, and predictive flags are delivered to field engineers with enough lead time to plan interventions, validate certifications, and prevent unplanned failures during operations.
Explore Aquila's annular health dashboard →
BOP leak detection, hydraulic pressure monitoring, BOP failure prediction
Extended BOP testing, BOP test interval extension, reduce BOP downtime
Fleet-wide BOP analytics, BOP fleet monitoring, fleet reliability
BOP predictive maintenance, reliability centered maintenance, condition-based maintenance